This dialog displays information about profiles. A profile is a collection of data about what was being executed by the system while work was done. Usually, you want to profile your own functions working or your own applications running. Profiling the operation of the IDE itself rarely provides useful information about your code.
To start collecting profiling date, click Run | Start/Resume Profiler. When you feel enough data is collected, stop profiling with Run | Stop Profiler. Now you are ready to analyze the data using this dialog.
When the dialog is displayed, no information is displayed. Click on Update to analyze the current profile data. (If while analyzing one profile, you collect data for another, click on update to analyze this new data. When new data is analyzed, old data is discarded unless saved.)
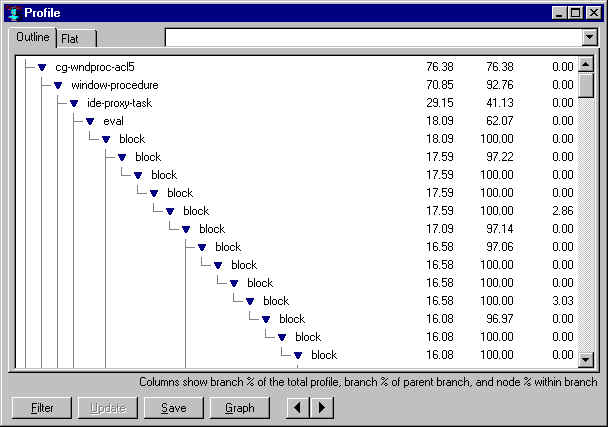
The two tabs present the data in two ways. Illustrated above is the outline presentation. Below is the flat presentation. Nodes in the outline indicate functions called, as do the entries in the left column of the flat display.
Clicking the Graph button presents the information in a graph such as the following:
The colored bars on the left next the graph nodes indicate the portion of the time spent in the node as a fraction of the time spent in the parent node. If there is a green line (none are illustrated), that is the portion of time spent in the indicated function in this node (the same function also appears in other nodes). The yellow line to the right of a node indicates the time spent in subnodes of the node as a fraction of the total time spent in the node.
Filter: click this button to display a dialog showing types of nodes not to display. Click update after modifying the filter to see the modified display.
Save: save the profile data. It becomes named by a symbol specified in a dialog that appears. The symbol appears in the drop-down list at the top of the dialog and changing the value shown there reverts the display to that profile data and filter.
Common Graphics and IDE documentation is described in About Common Graphics and IDE documentation in cgide.htm.
The documentation is described in introduction.htm and the index is in index.htm.
Copyright (c) 1998-2000, Franz Inc. Berkeley, CA., USA. All rights reserved.
Created 2000.10.5.